Animated bikes stocks

Séminaire System X, 6 Juin 2018 Etienne Côme COSYS/GRETTIA/IFSTTAR
 The Discriminative Functional Mixture Model for the Analysis of Bike Sharing Systems [preprint]
 The Discriminative Functional Mixture Model for the Analysis of Bike Sharing Systems [preprint]
 The Discriminative Functional Mixture Model for the Analysis of Bike Sharing Systems [preprint]
 The Discriminative Functional Mixture Model for the Analysis of Bike Sharing Systems [preprint]

|

|

|

|

|

|

|

|
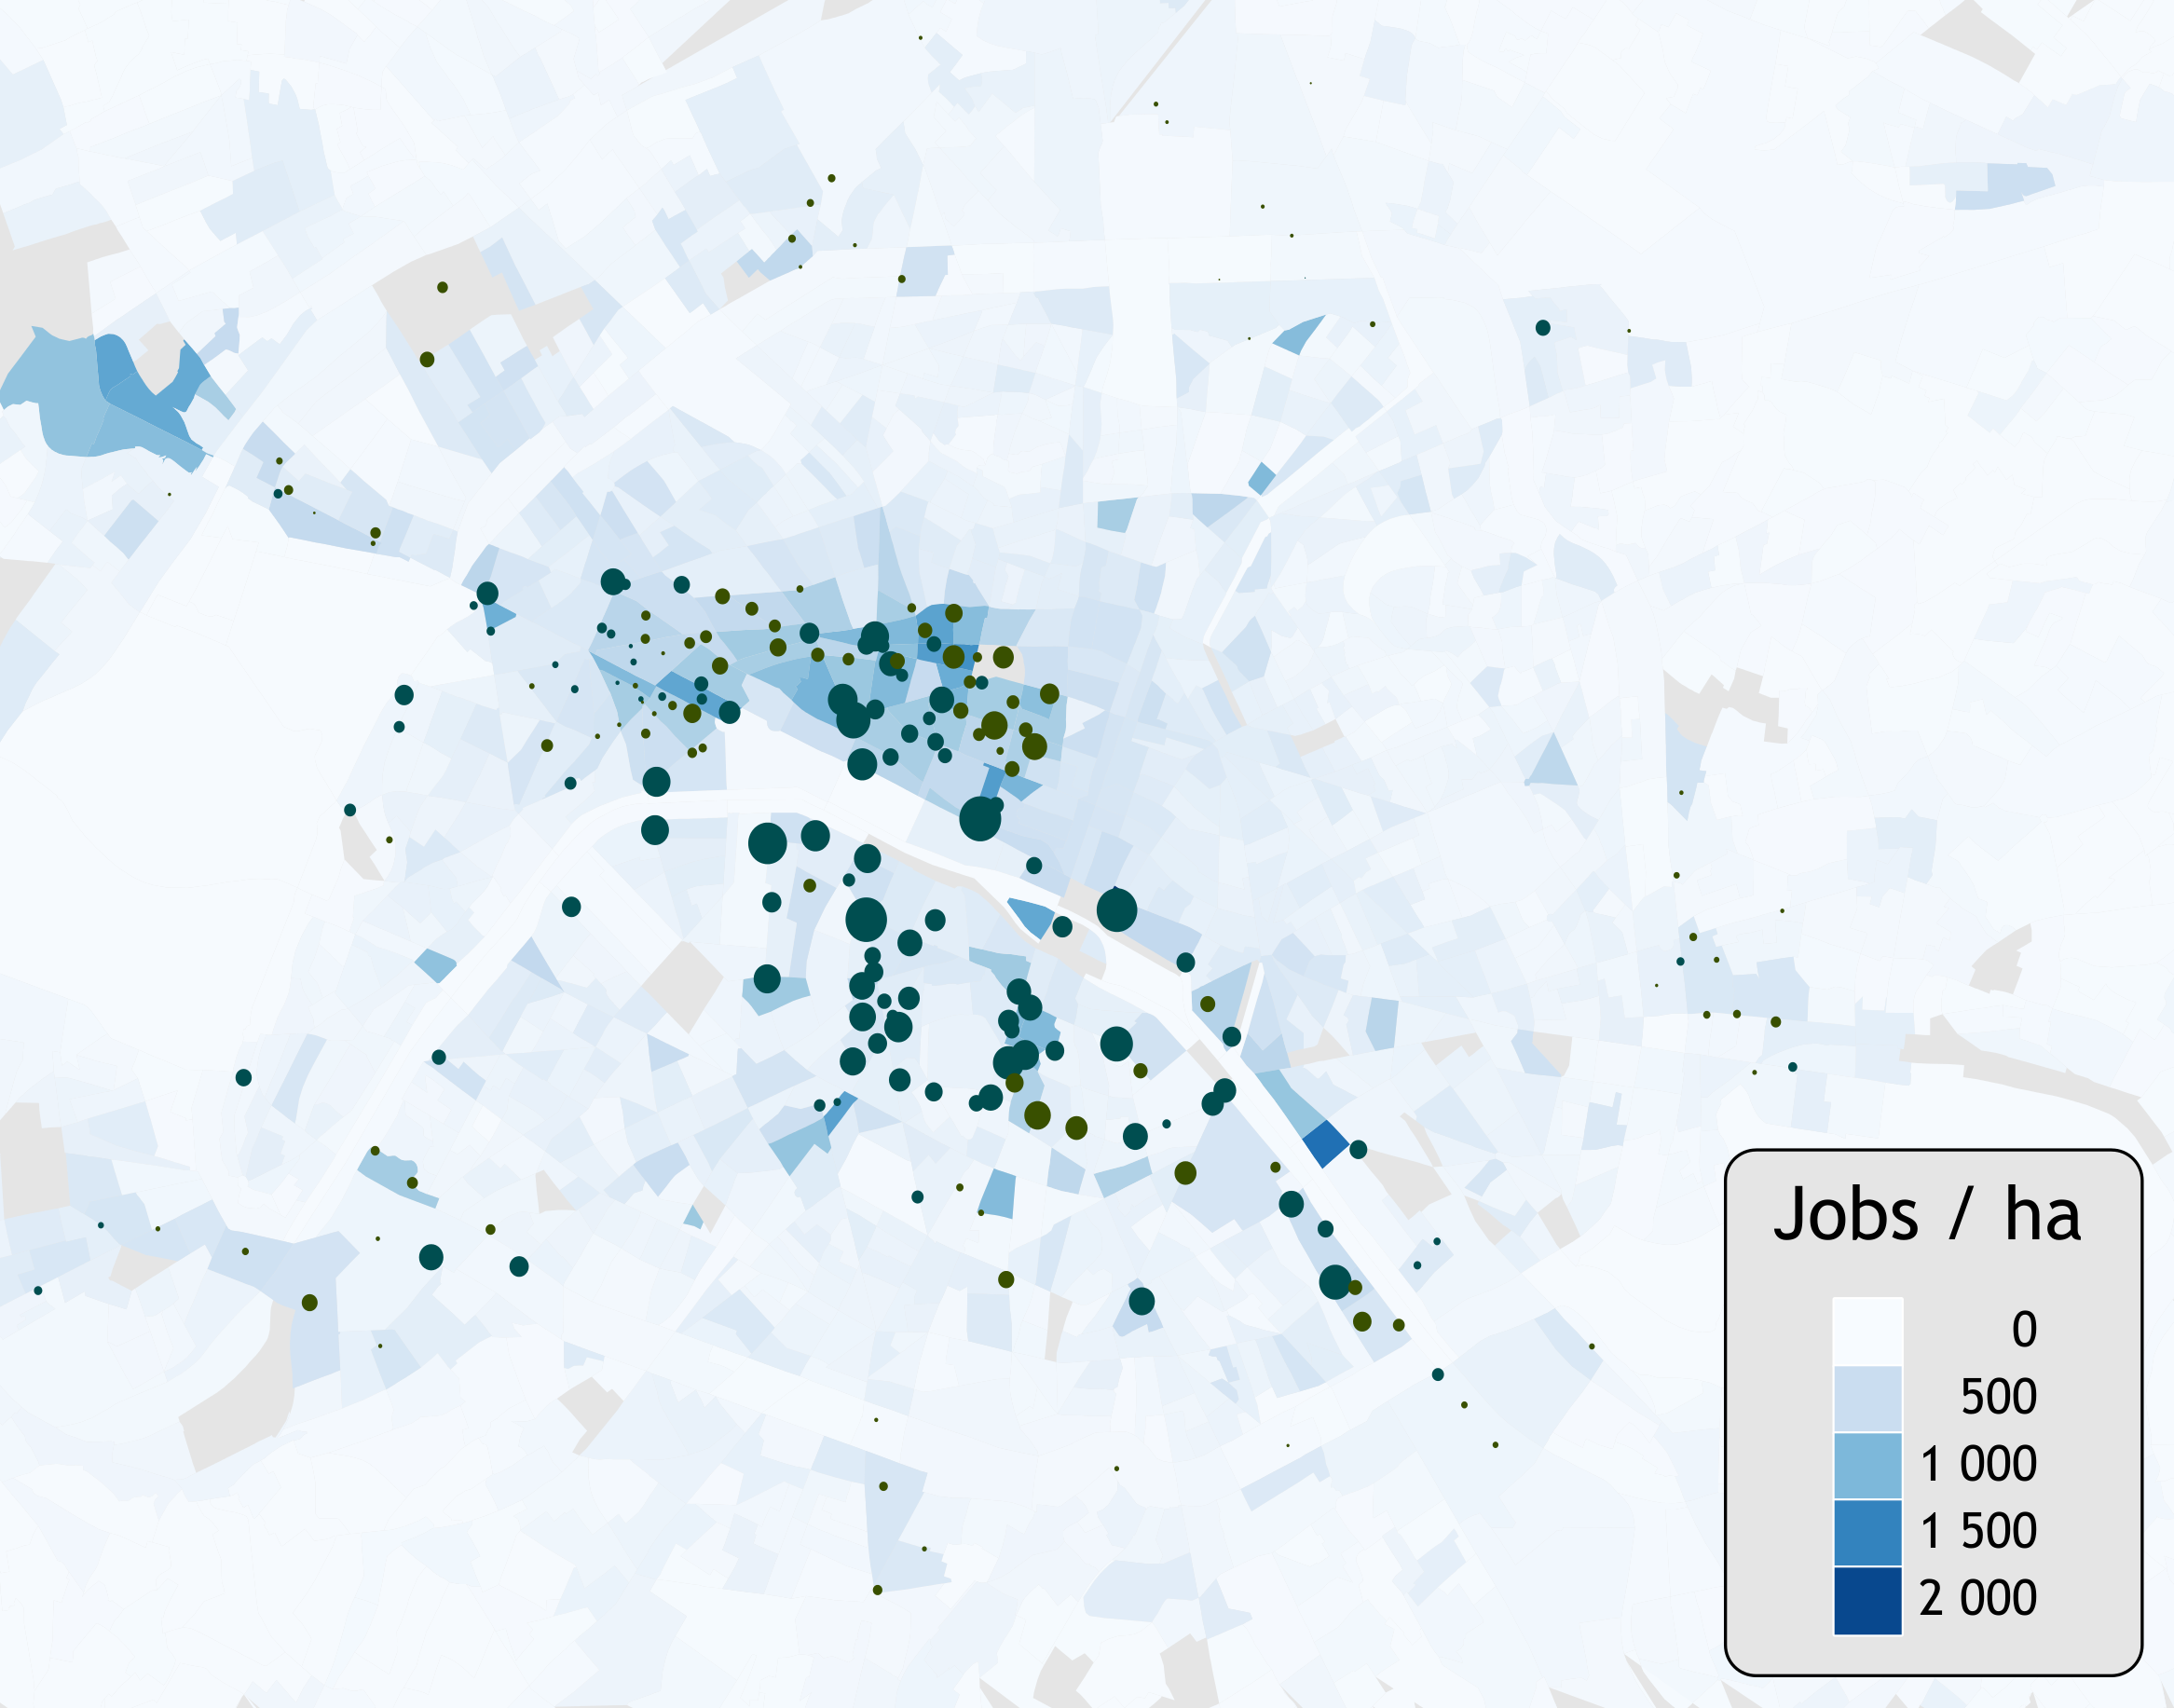
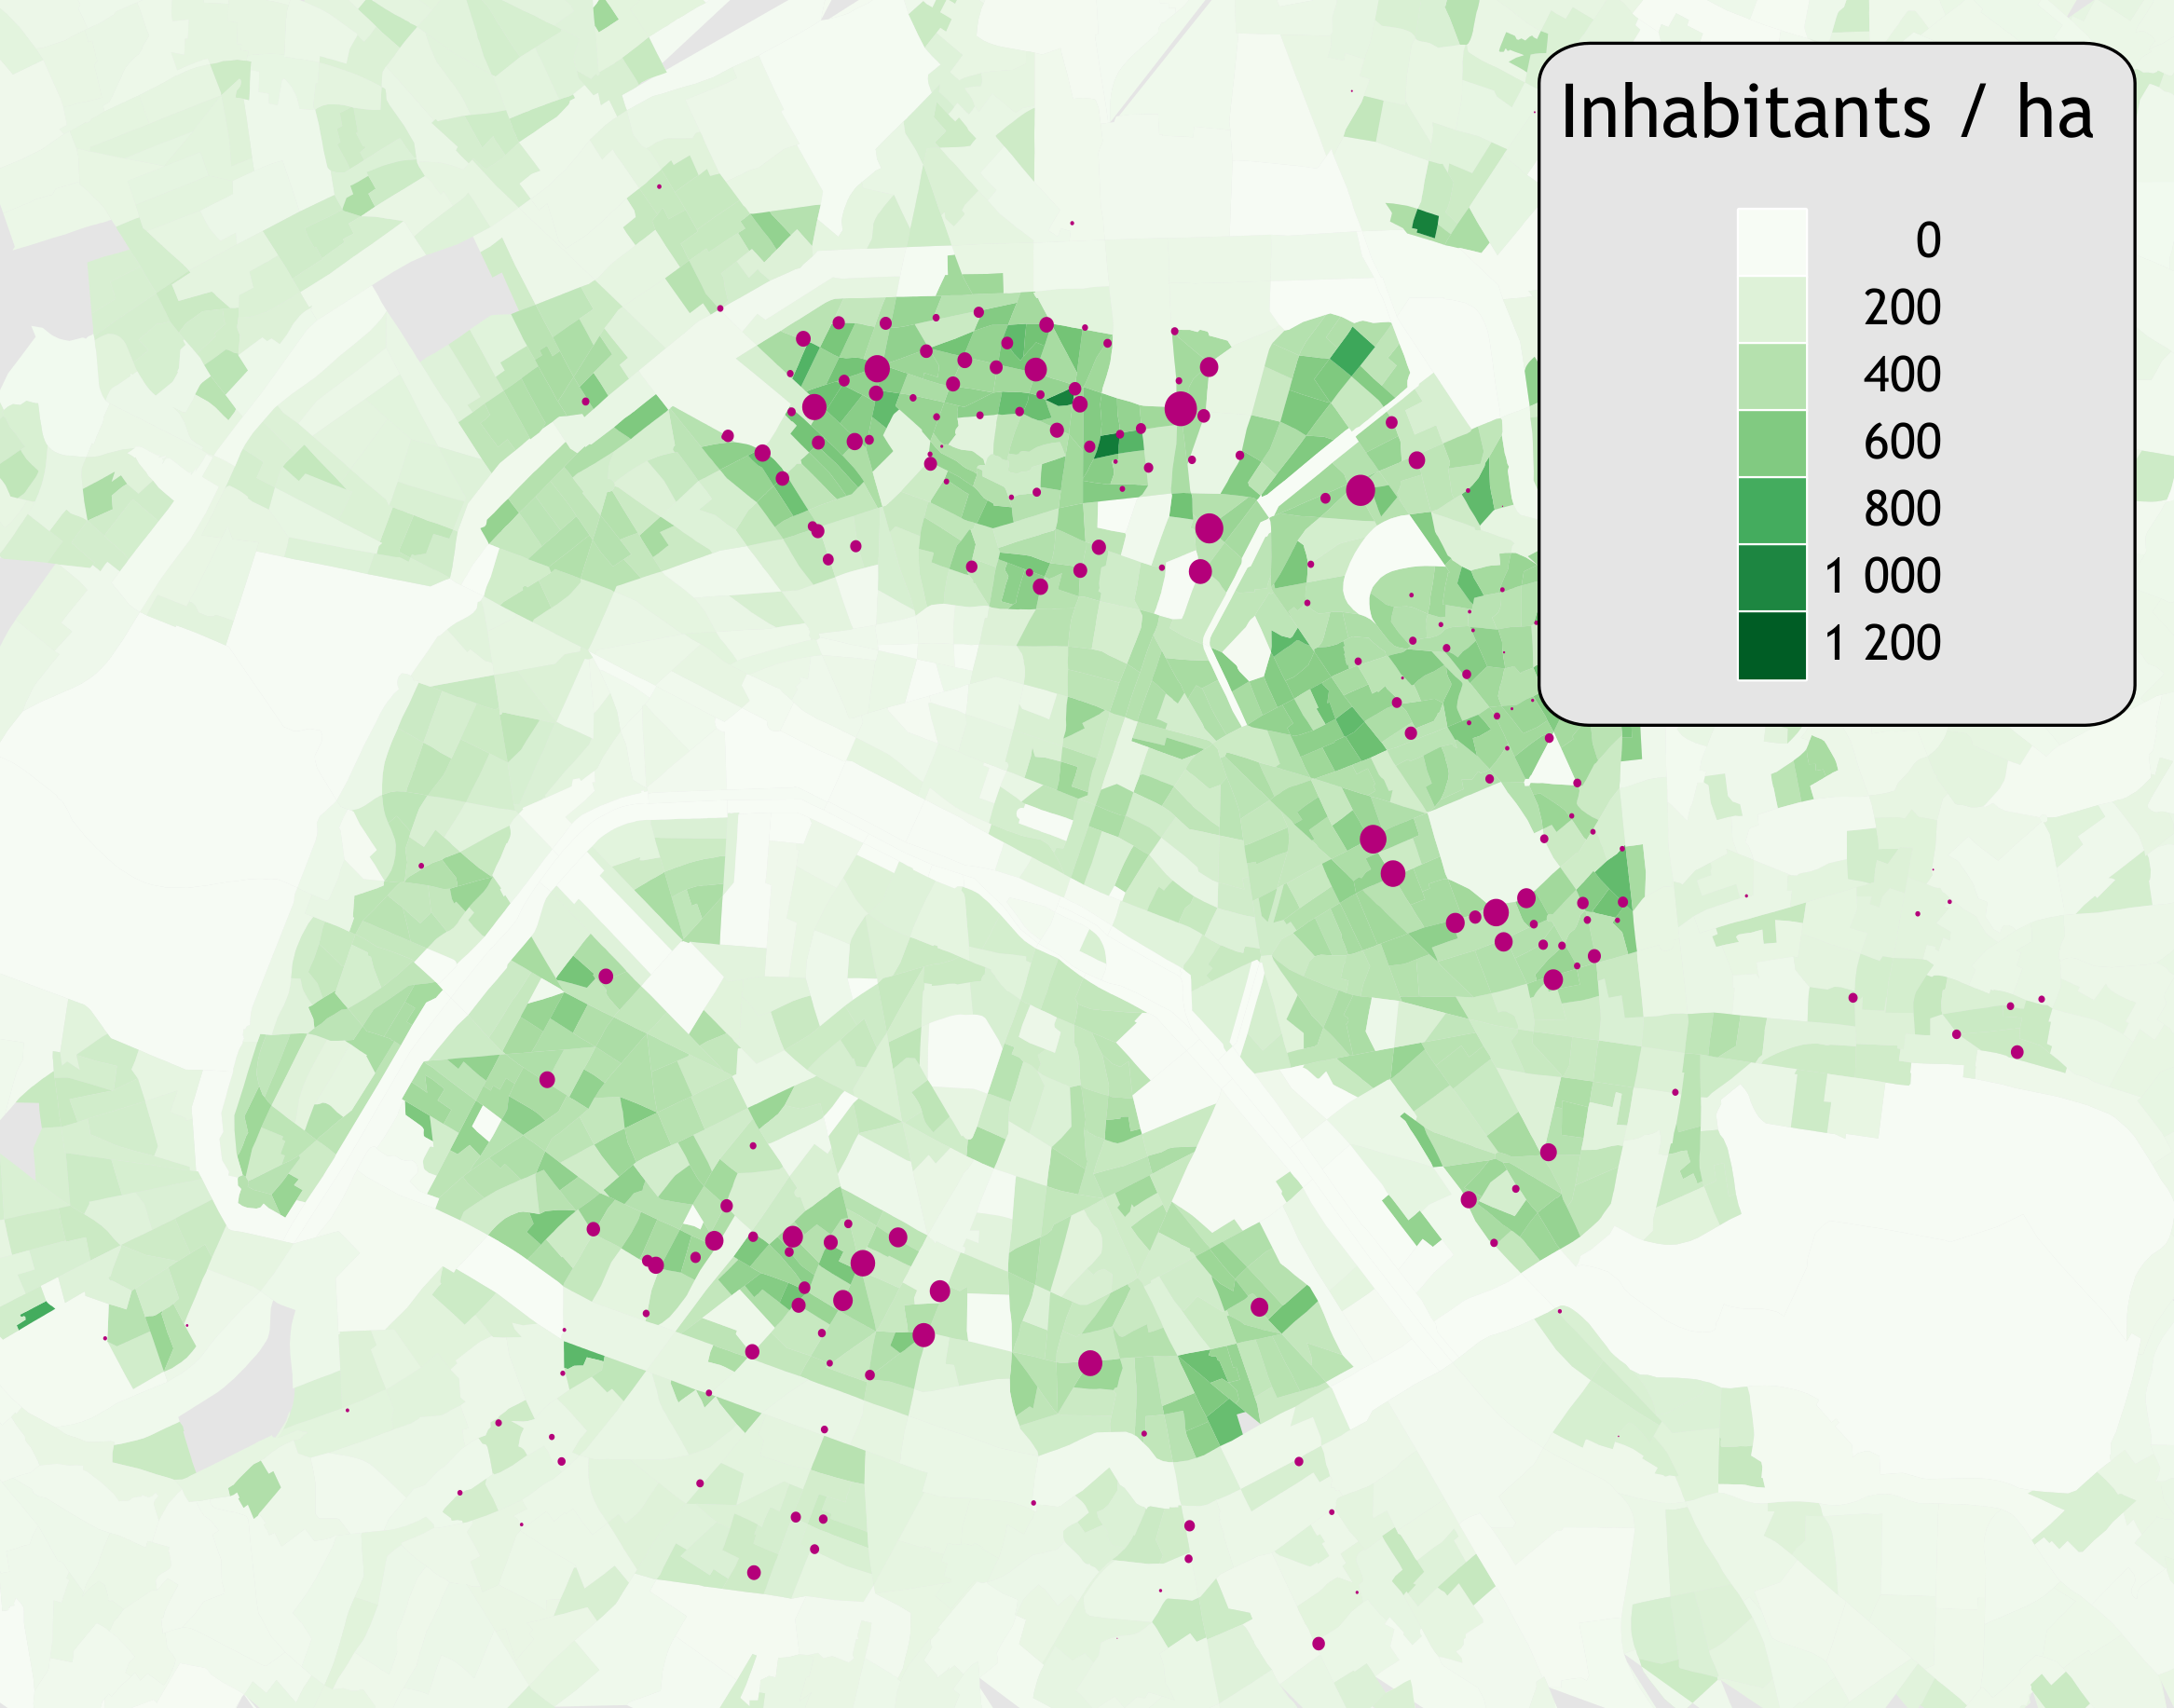
| hab/ha | emp/ha | serv/ha | com/ha | |
|---|---|---|---|---|
| * | 162 | 237 | 4.2 | 3.7 |
| Leisure (1) | 367 | 189 | 6.3 | 4.4 |
| Leisure (2) | 261 | 322 | 7.7 | 6.9 |
| Parks | 172 | 90 | 2 | 1.7 |
| Stations | 209 | 206 | 2.4 | 1.8 |
| Mixed | 375 | 108 | 3.8 | 2.7 |
| Jobs(1) | 138 | 409 | 4.5 | 2.8 |
| Jobs(2) | 157 | 456 | 5.7 | 5.6 |
| Average | 301 | 163 | 3.8 | 2.8 |
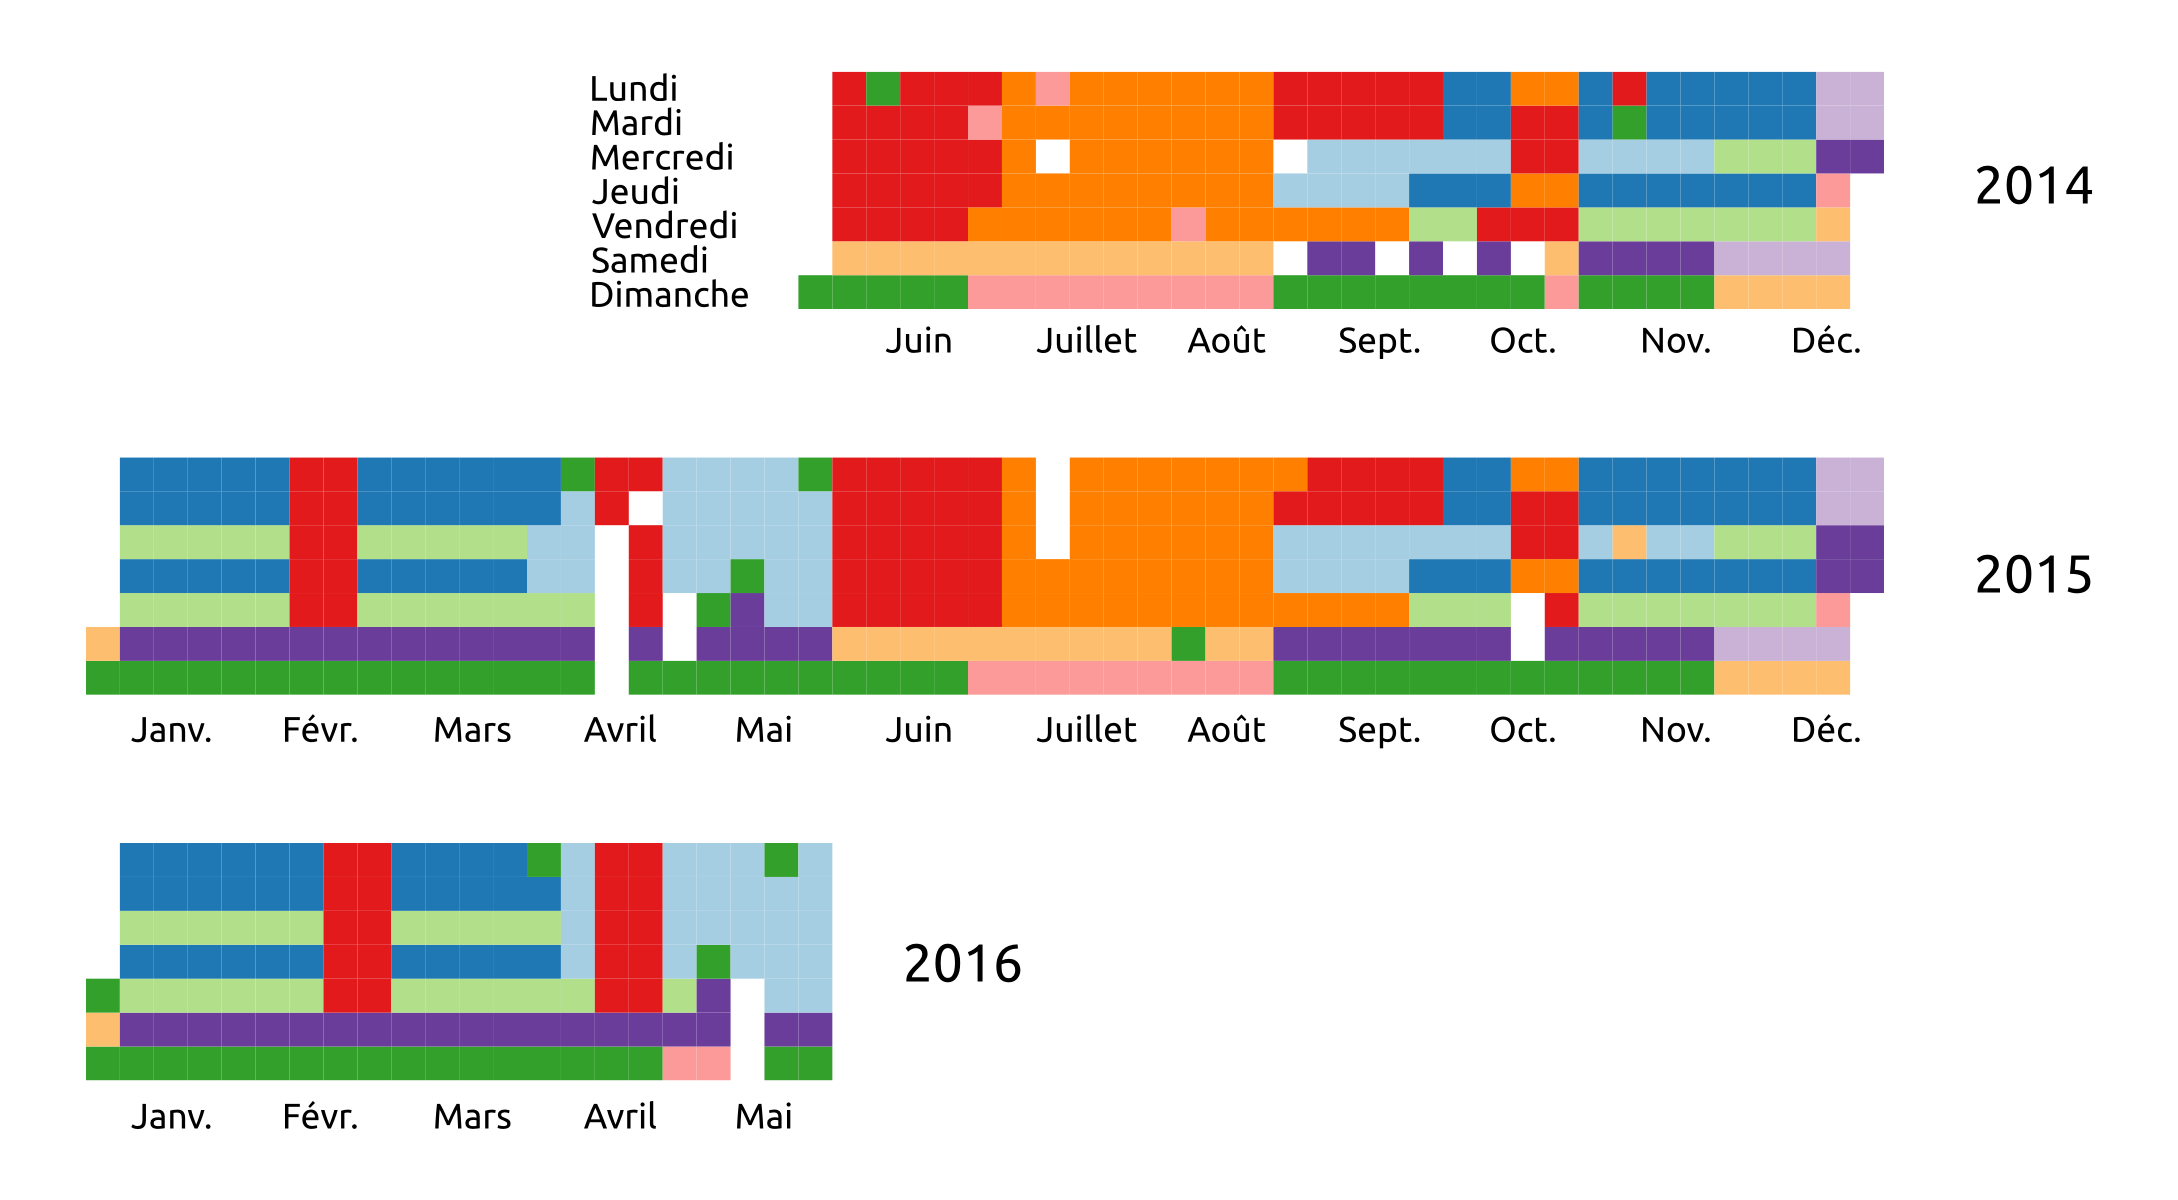
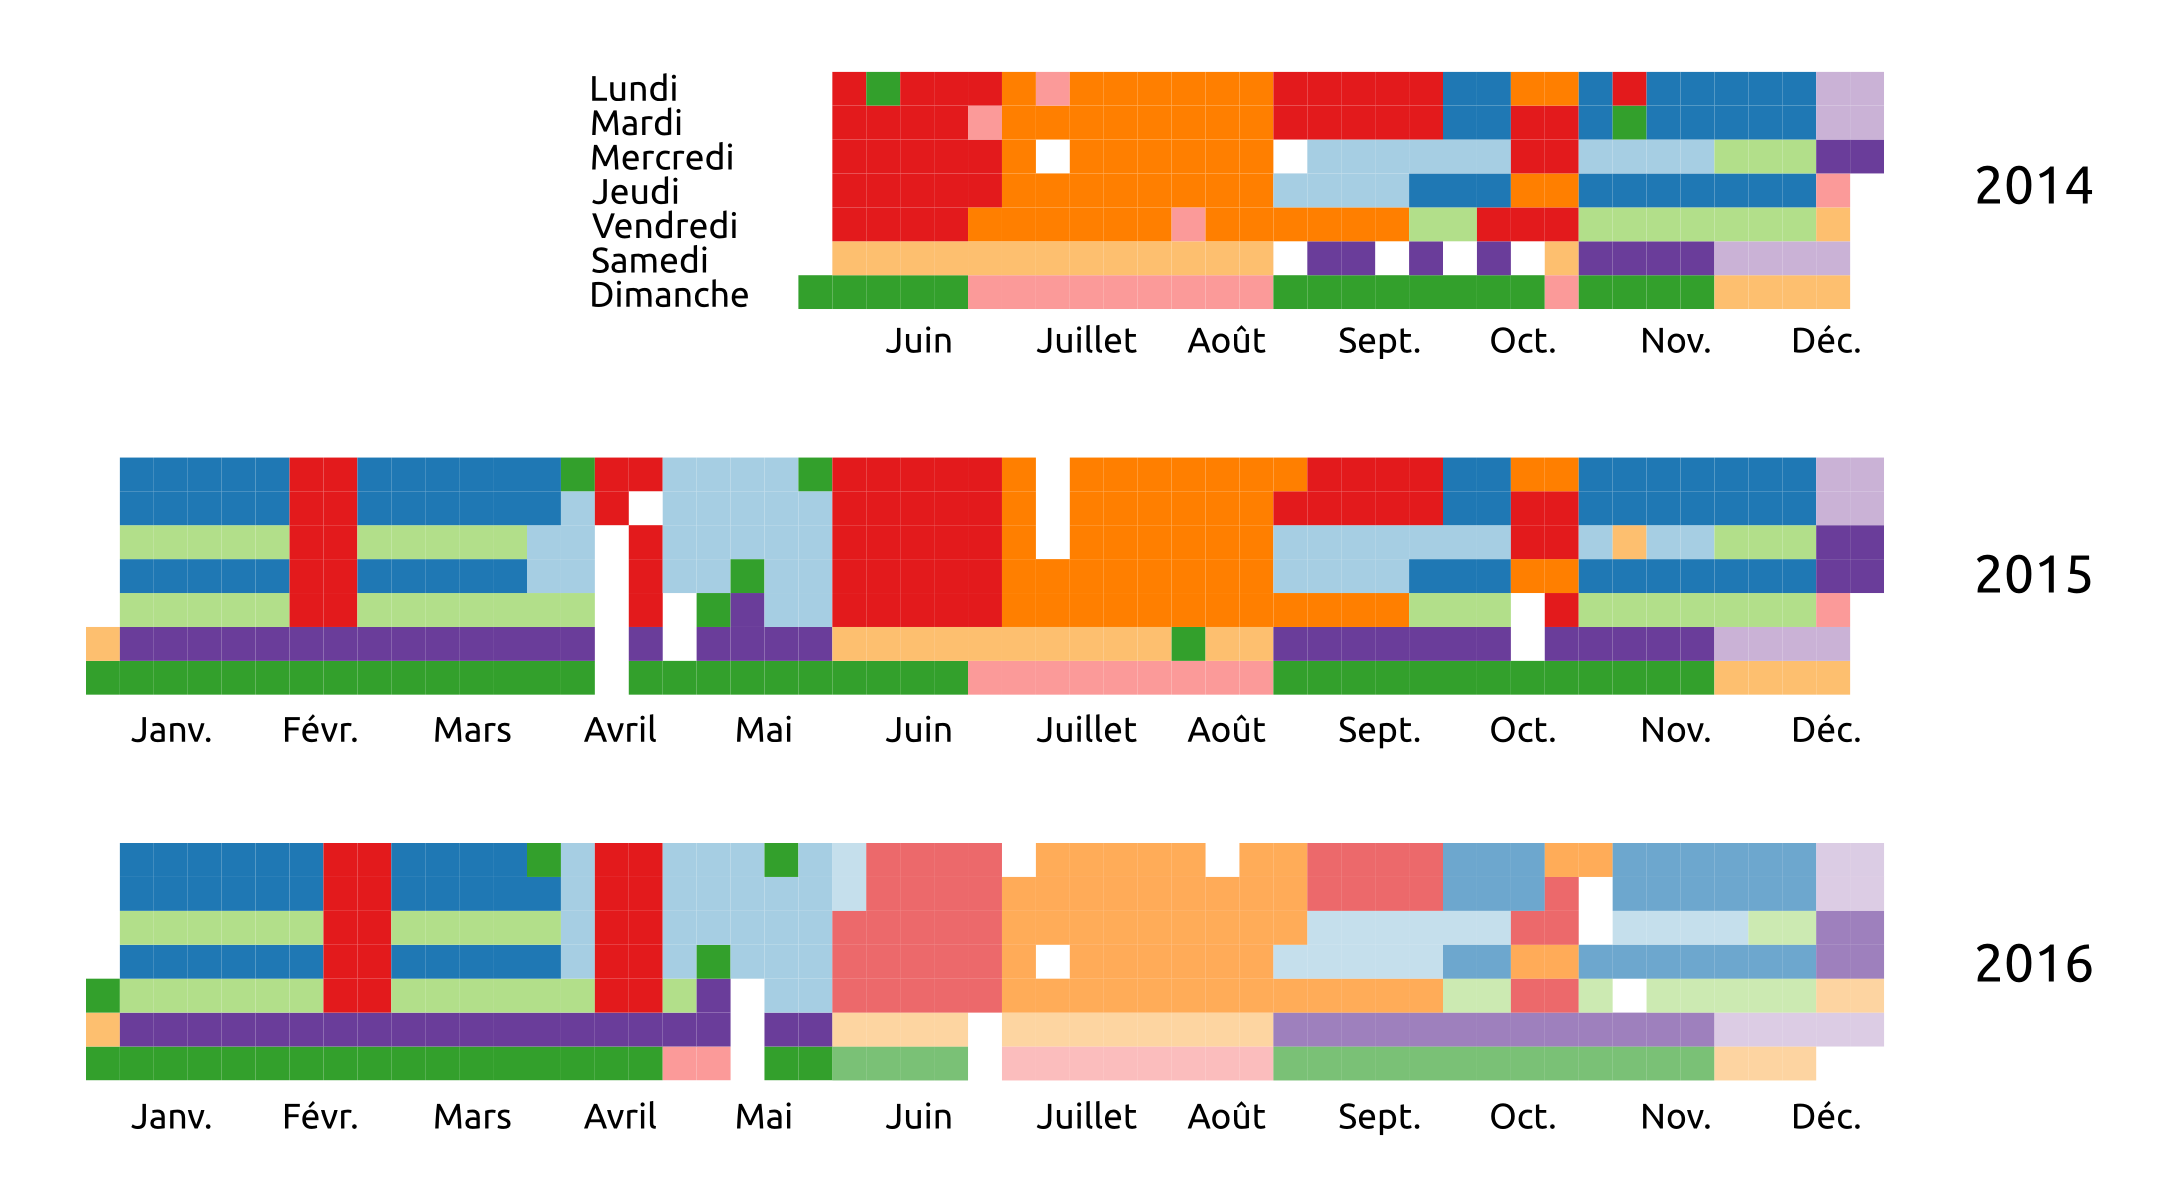
 Local stationarity of BSS behaviour / OD
Small bags of successive trips $\approx$ stationarity of OD
Documents (bags of words) = bags of successive trips (5000)
With :
Local stationarity of BSS behaviour / OD
Small bags of successive trips $\approx$ stationarity of OD
Documents (bags of words) = bags of successive trips (5000)
With :
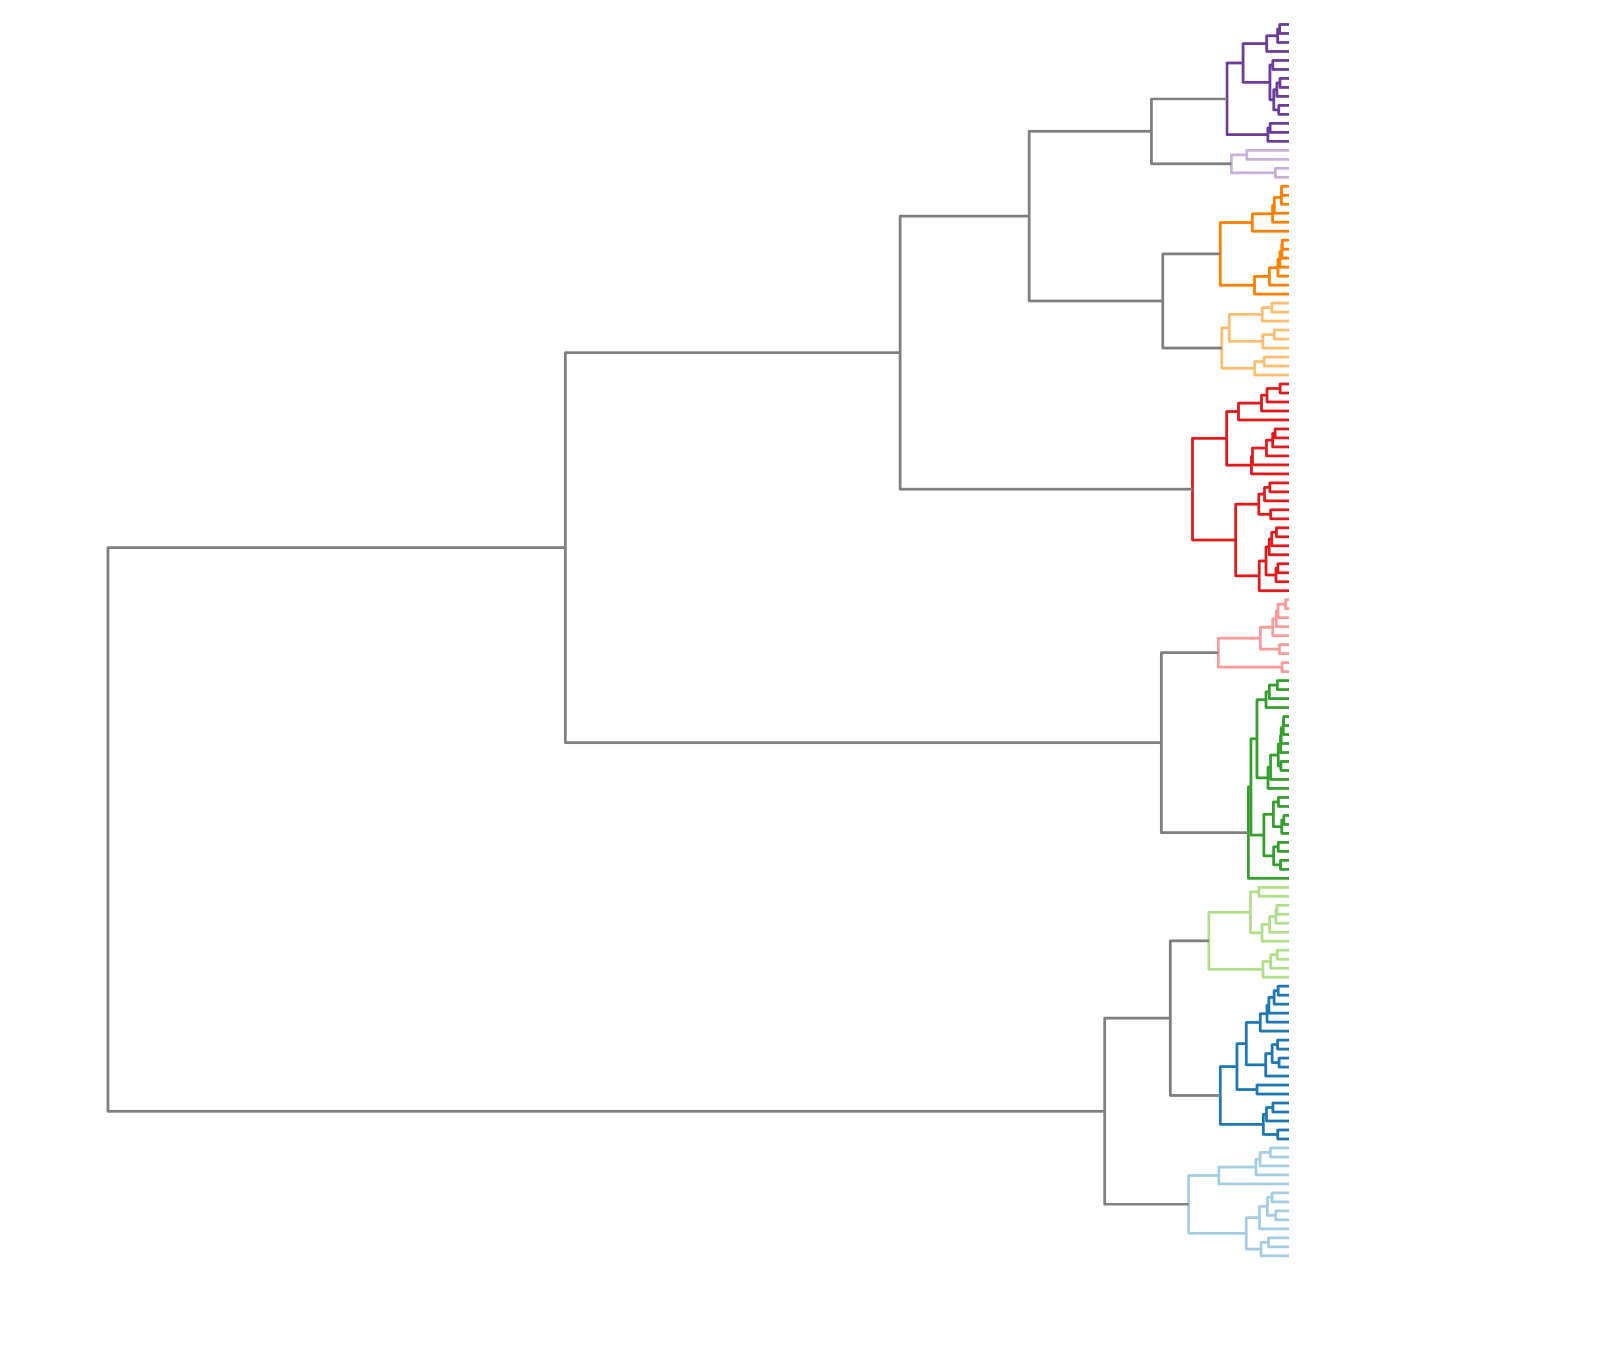
 Model selection with perplexity analysis(clear drop for K=5)


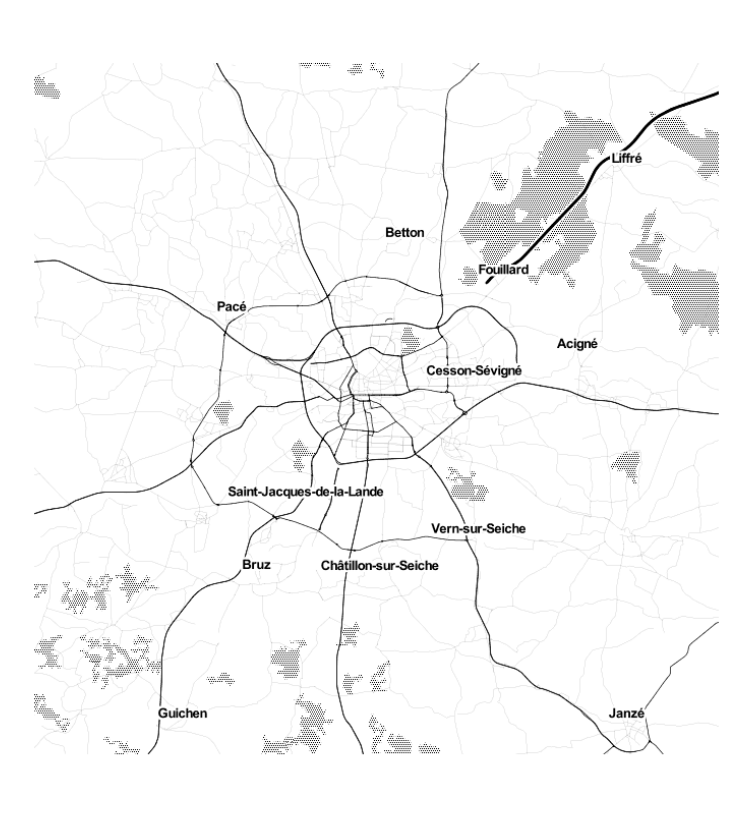


#Rennes #metro #Star des chaises jetées sur la ligne aérienne de métro à Villejean. Dégâts importants. Trafic interrompu pendant 2h?
— Samuel Nohra (@SamuelNohra) 29 mars 2016


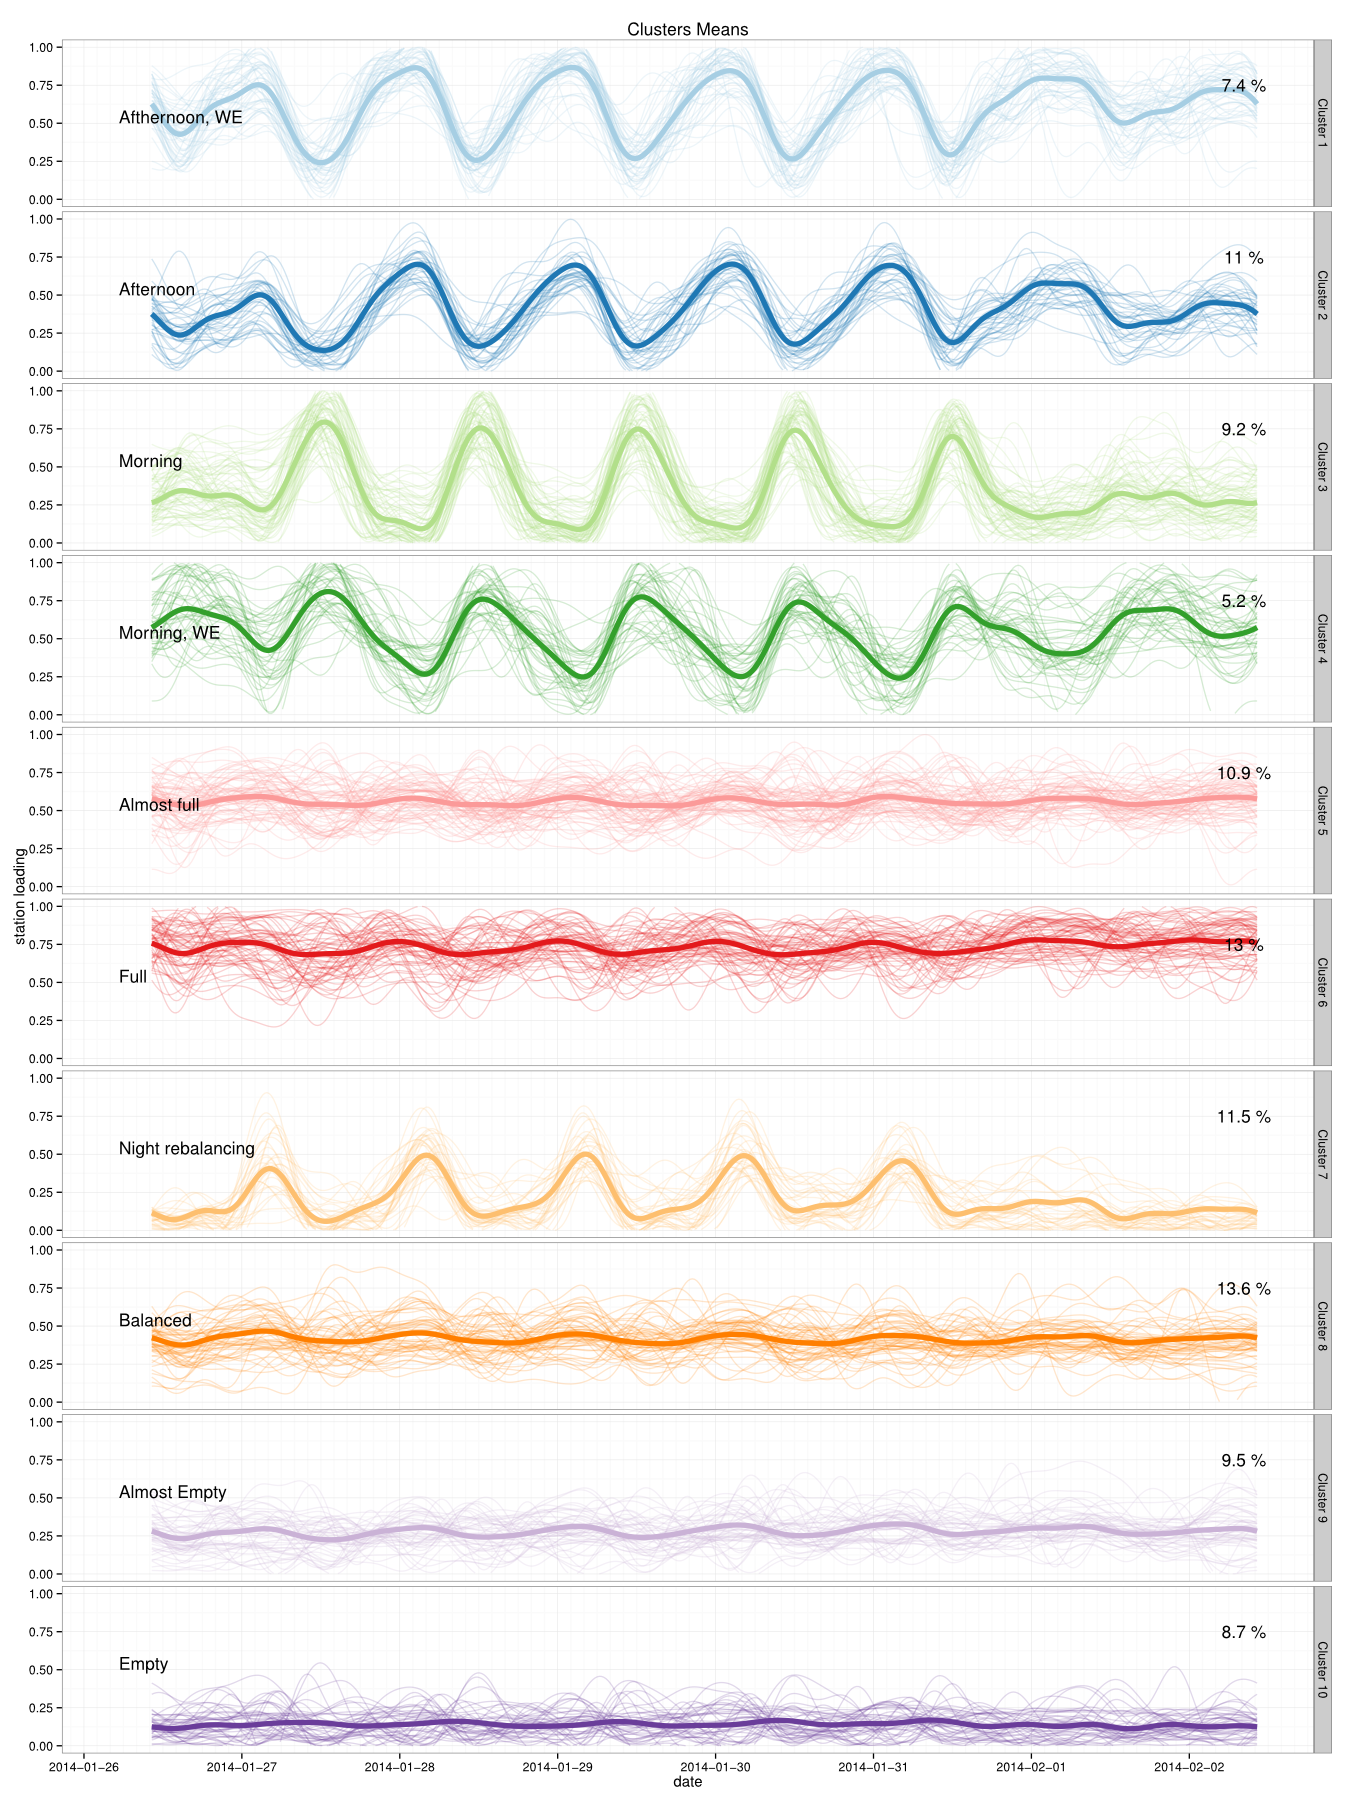
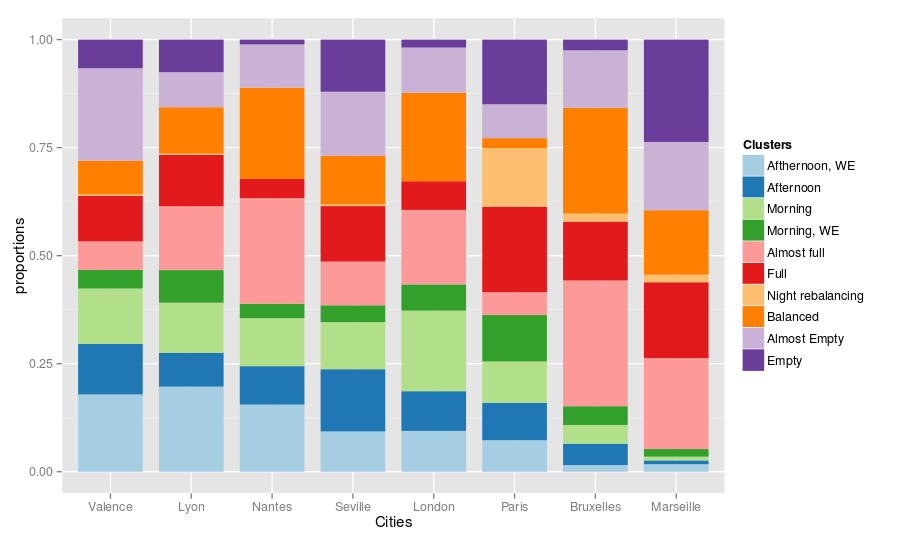
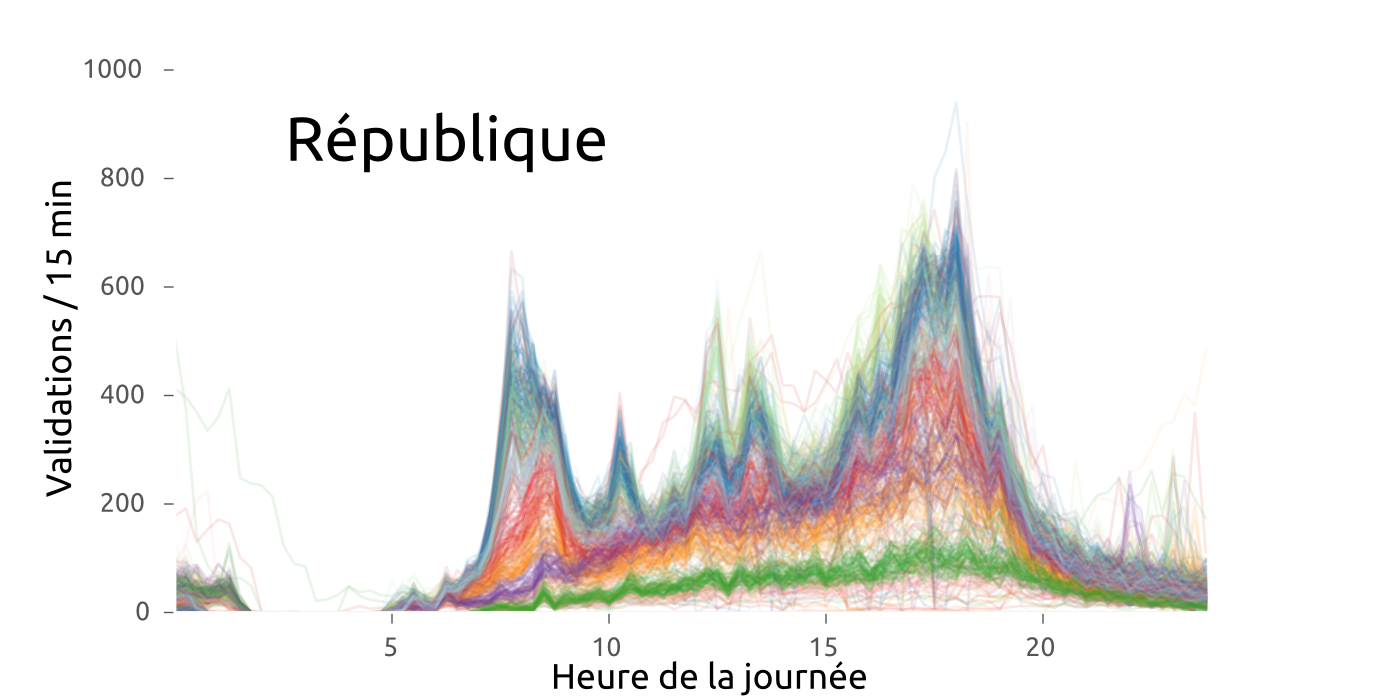
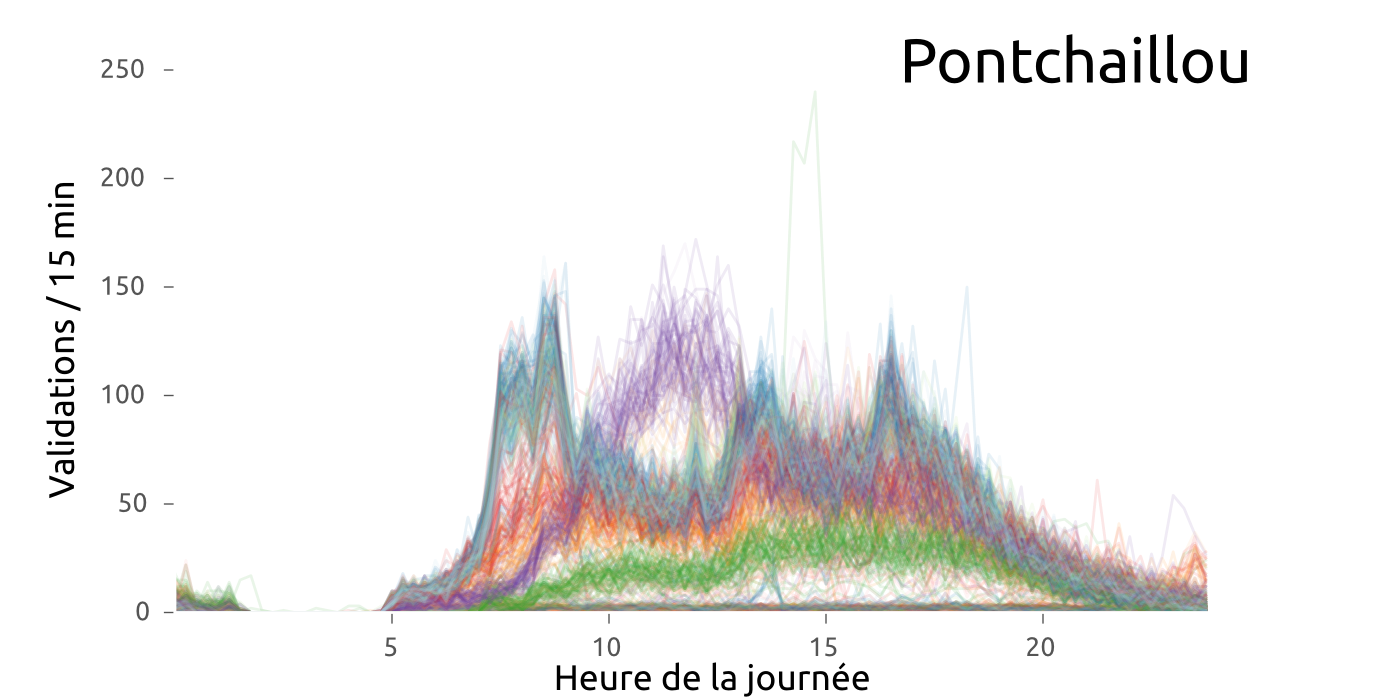
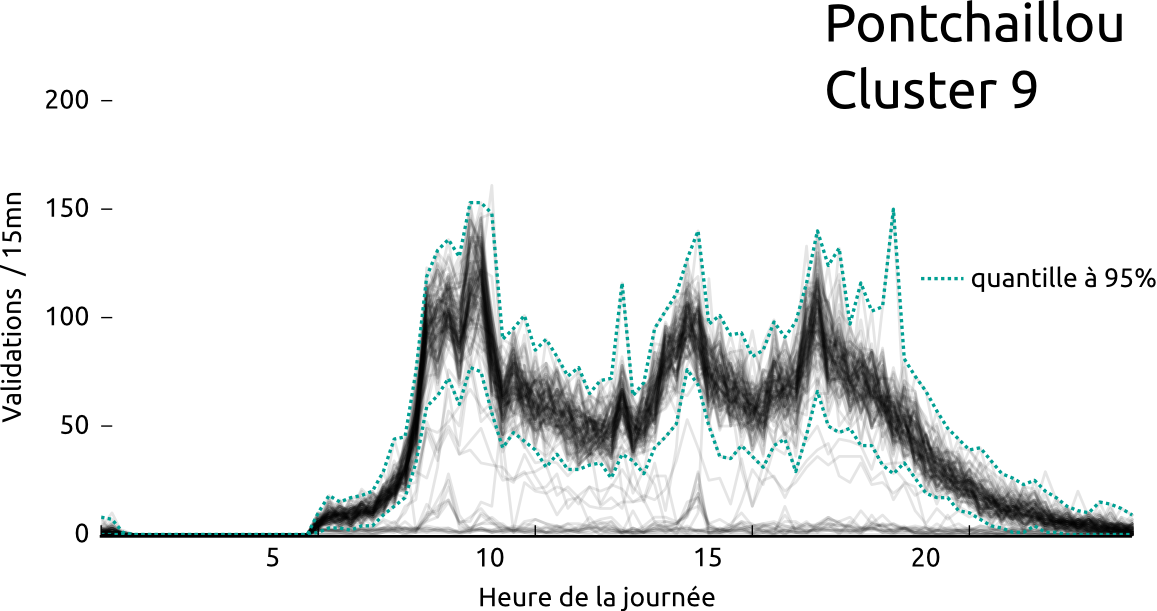
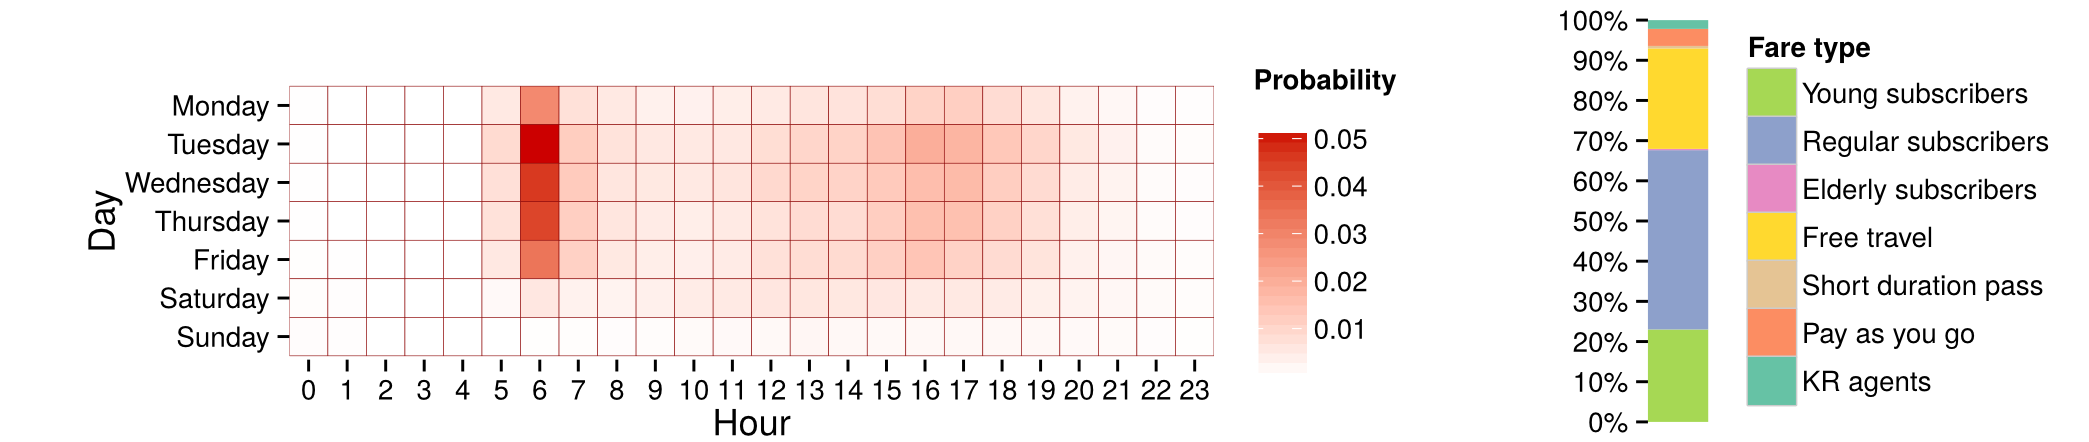
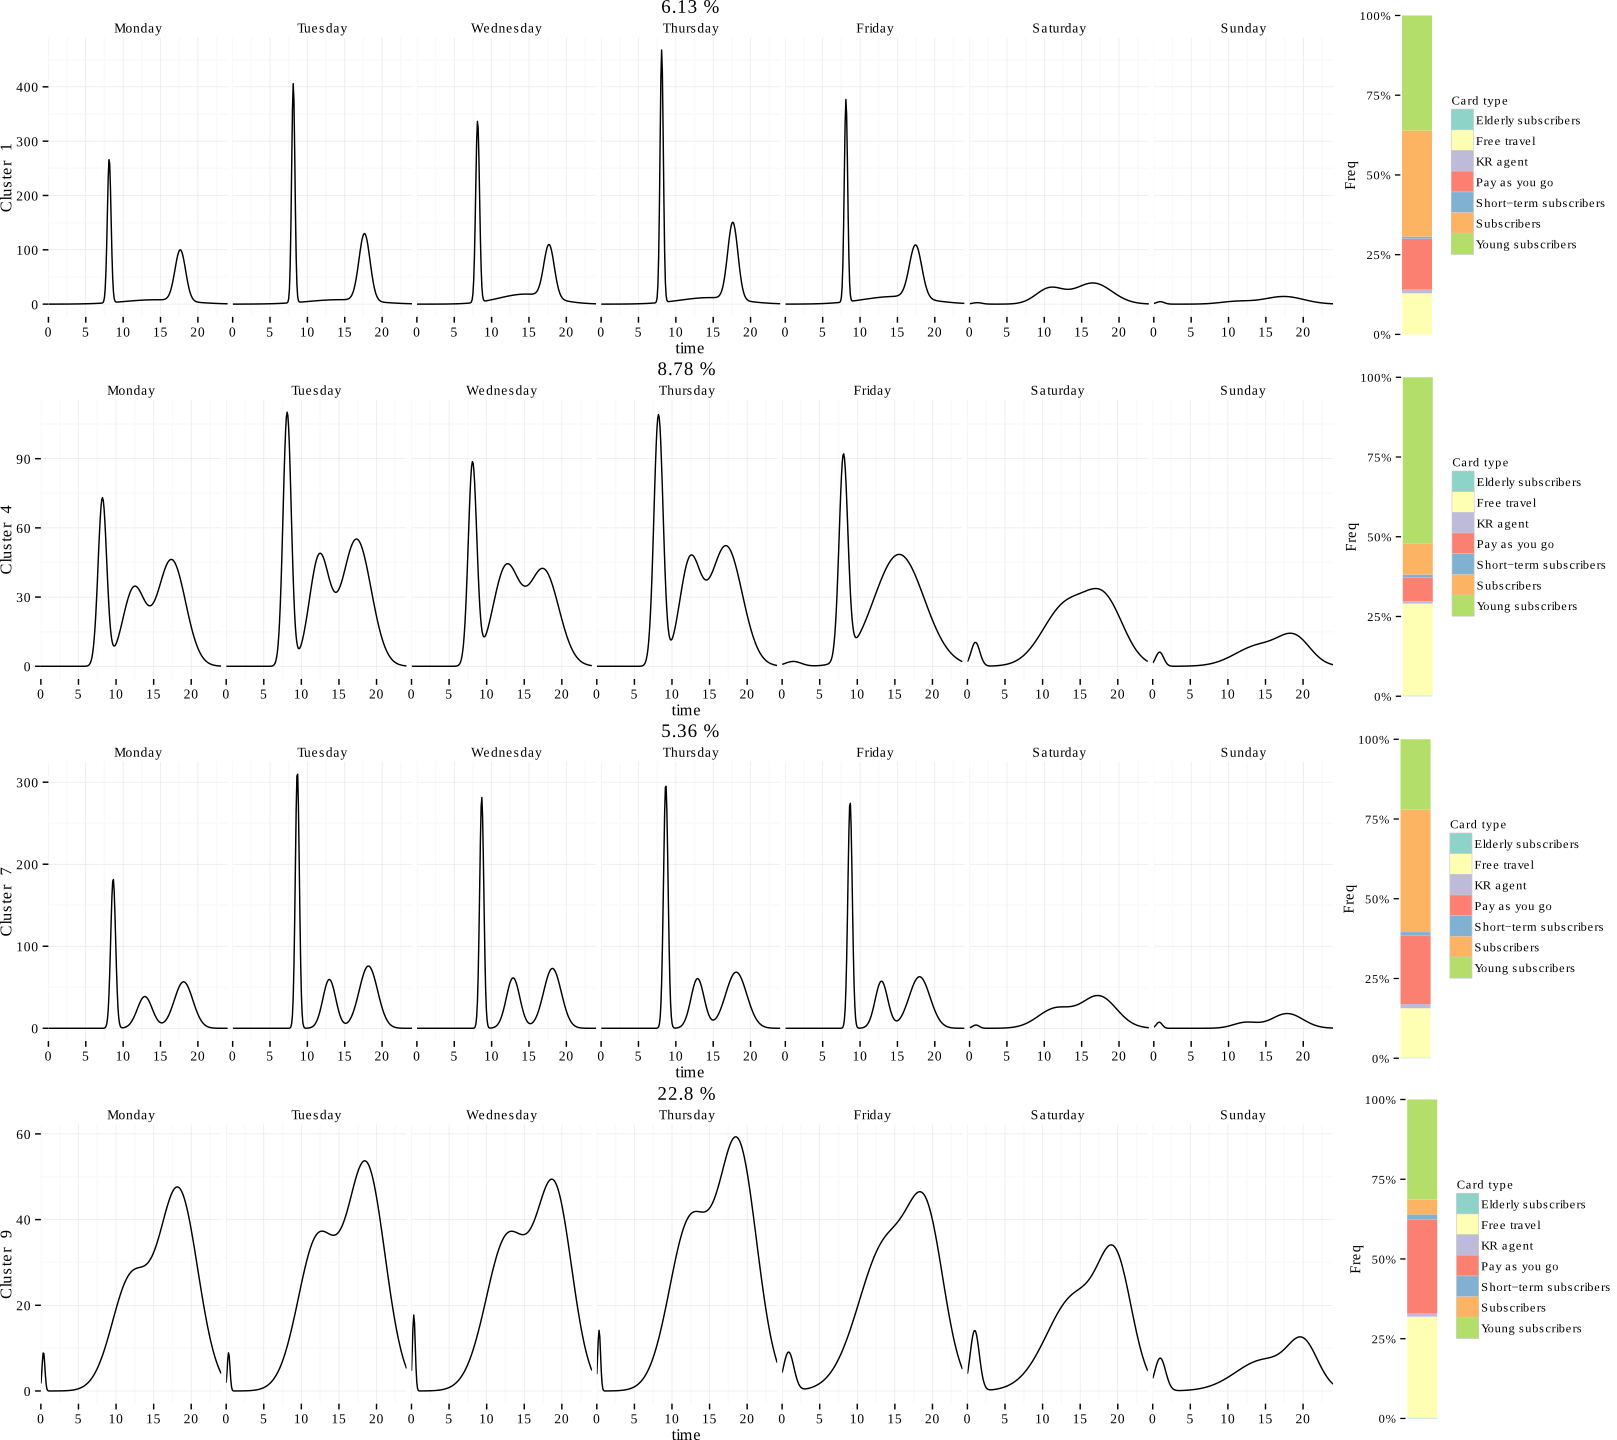
 Mean profile of a cluster with 4.55% of users
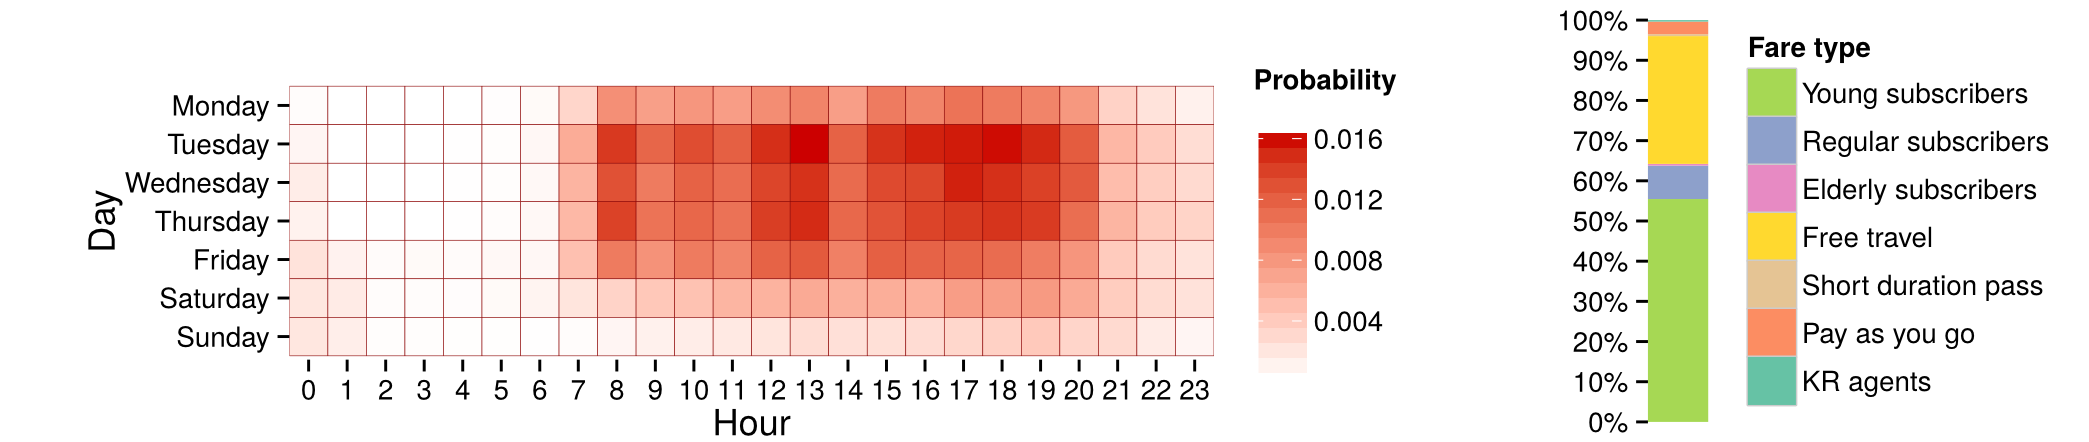
 Mean profile of a cluster with 12.54% of users
 Mean profile of a cluster with 3.6% of users
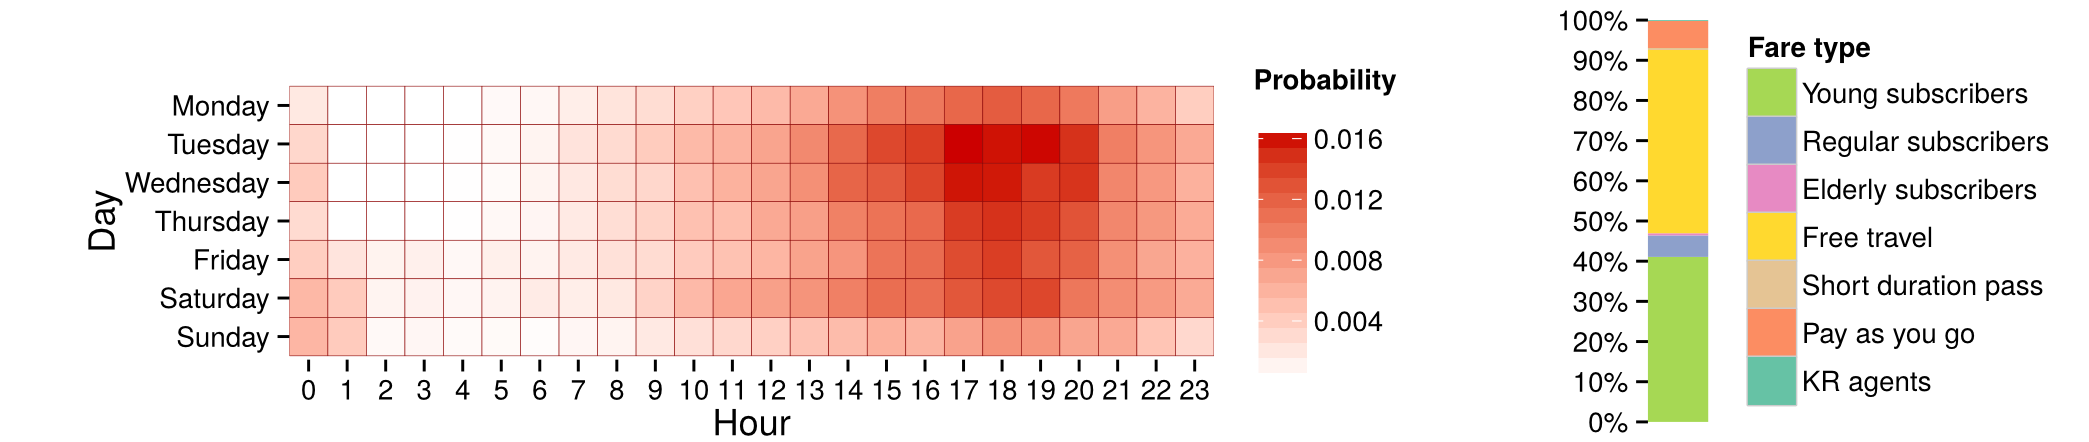
 Mean profile of a cluster with 15.13% of users
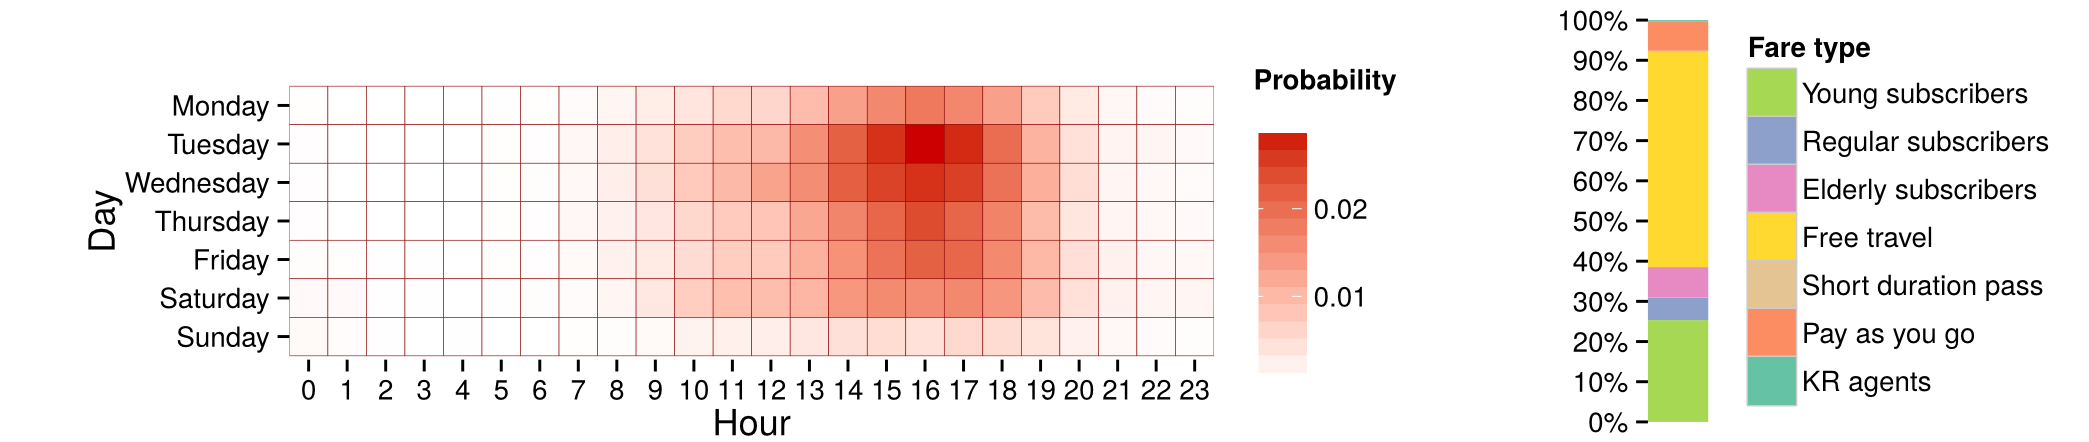
 Mean profile of a cluster with 6.44% of users
 Mean profile of a cluster with 8.64% of users
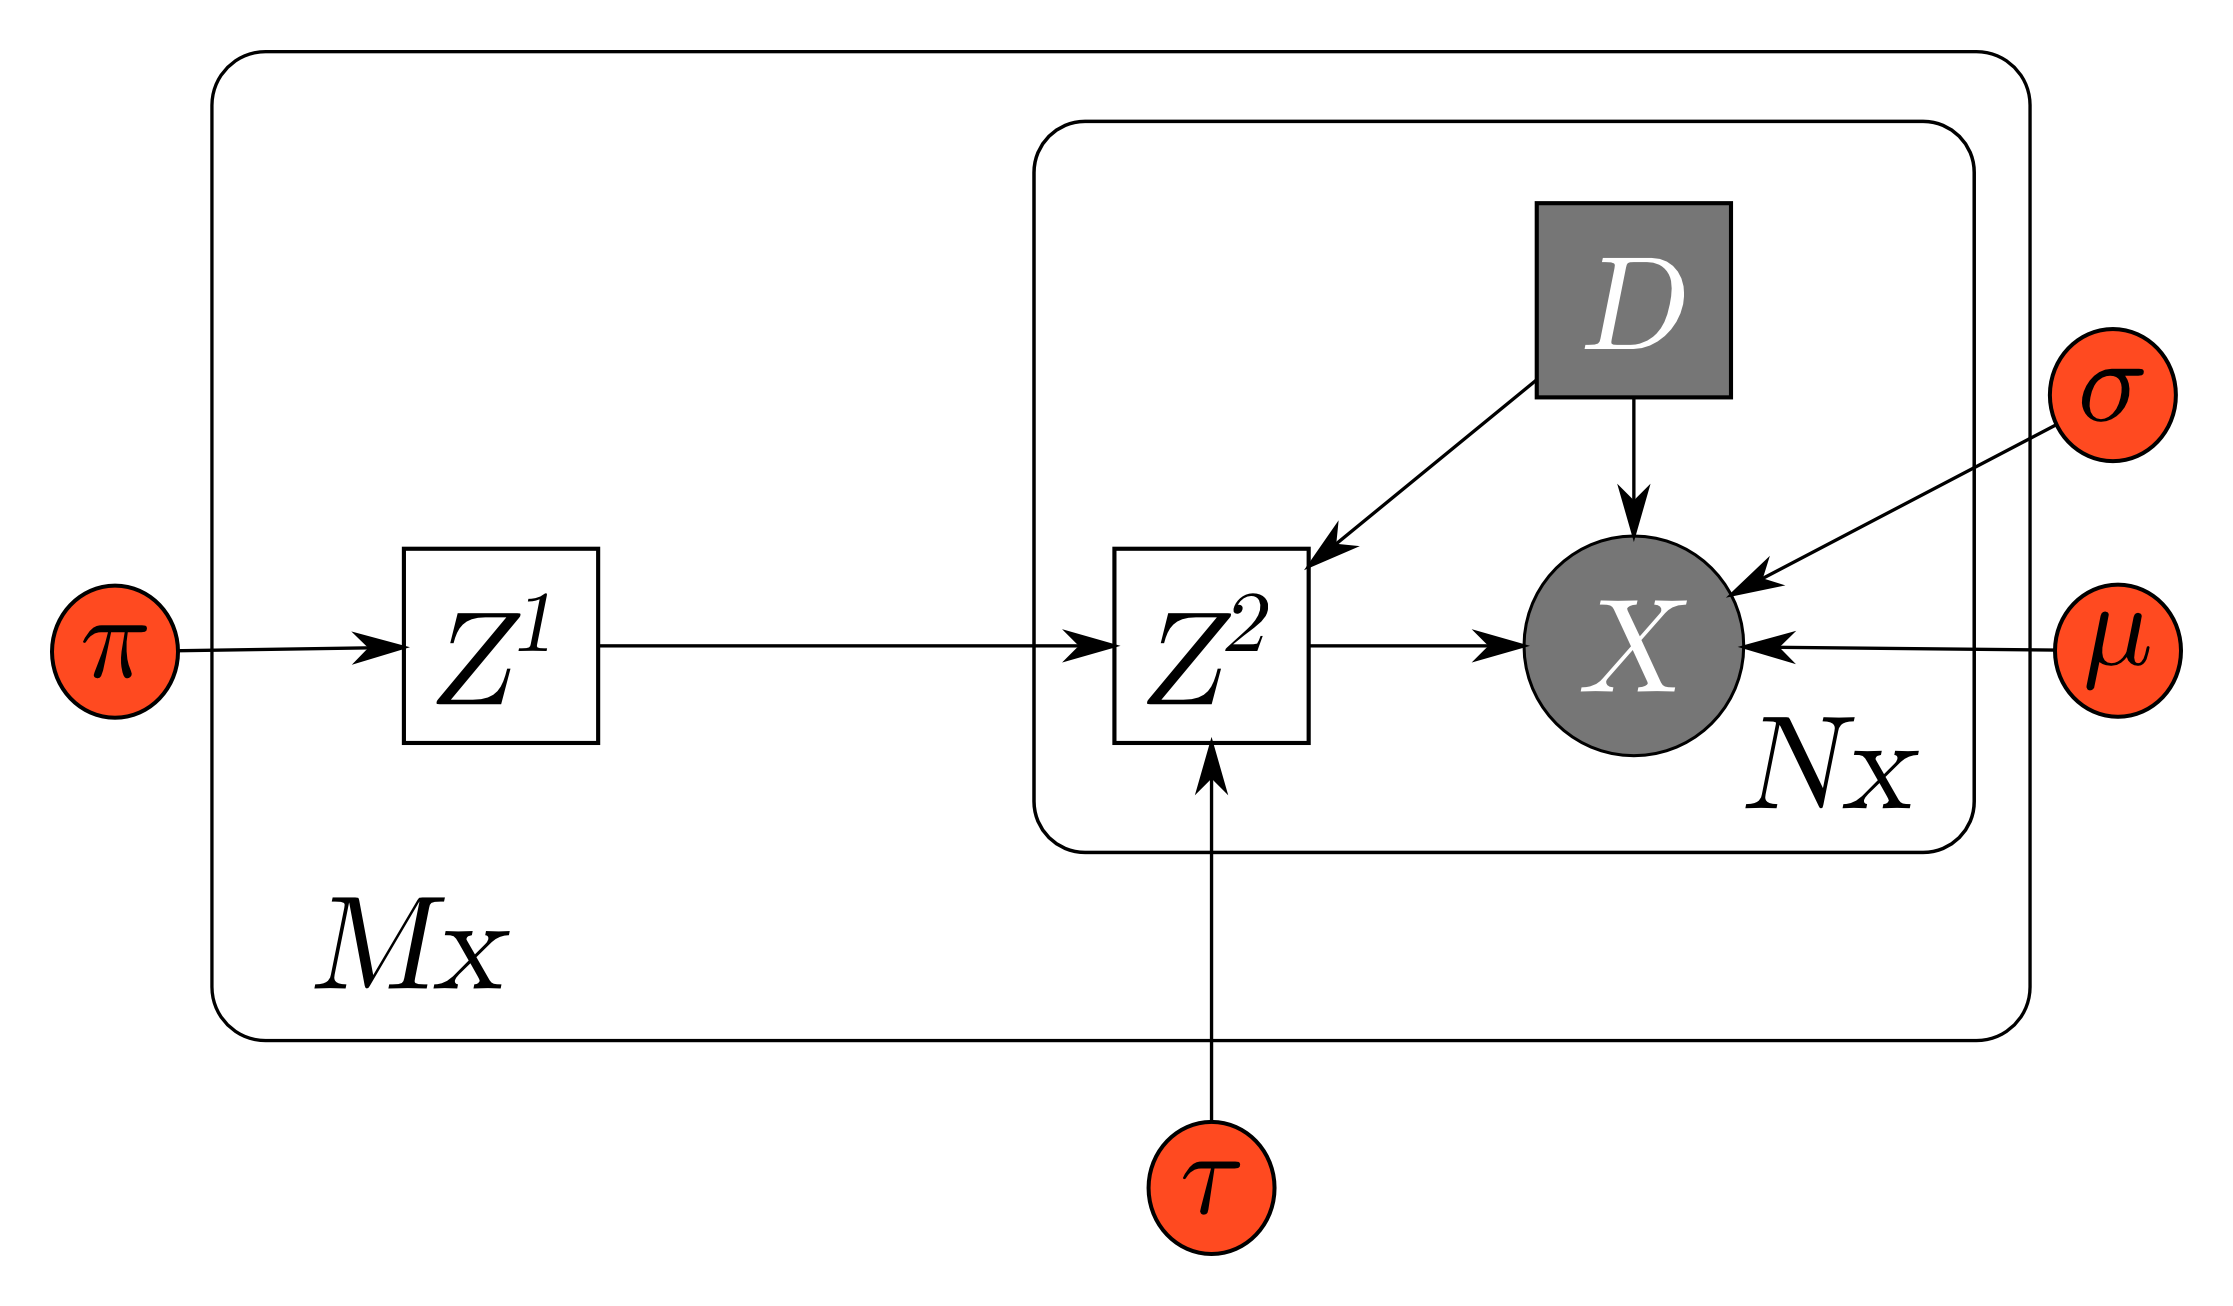 Generative model for continuous time user clustering
El Mahrsi, M., Briand, A. S., Côme, E., & Oukhellou, L. "Utilité des données billettiques pour l’analyse des mobilités urbaines: le cas rennais" Données urbaines, Economica, 2015, 11p. El Mahrsi, M., Côme, E., Oukhellou, L. & Verleysen, M. "Clustering Smart Card Data for Urban Mobility Analysis" Ieee Transactions on Intelligent Transportation Suystems ( Volume: PP, Issue: 99 ), pp 1 – 17, 2016. Briand, A. S., Côme, E., El Mahrsi, M., & Oukhellou, L. "A mixture model clustering approach for temporal passenger pattern characterization in public transport", International Journal of Data Science and Analytics, Avril 2016, Volume 1, issue 1, pp 37-50. Briand, A. S., Côme, E., El Mahrsi, M., & Oukhellou, L. "Classification á base de Modèle de mélange pour l’identification de profils temporels types d’usagers de transport public" AAFD & SFC’16 : Conférence Internationale Francophone sur la Science des Données, Marrakech, 2016. Toqué, F., Côme, E., El Mahrsi, M., Oukhellou, L. "Forecasting Dynamic Public Transport Origin-Destination Matrices with Long-Short Term Memory Recurrent Neural Networks". In Proceedings of IEEE 19th International Conference on Intelligent Transportation Systems , Rio de Janeiro , BRESIL 2016.
Briand, A. S., Côme, E., Trépanier, M., & Oukhellou, L. "Analysing year-to-year changes in public transport passenger behaviour using smart card data" Transportation Research Part C : Special Issue on Smartcard data (article accepté en cours de publication) Briand, A. S., Côme, E., & Oukhellou, L. "Anomalie detection and characterization in Smart-Card data" (article en cours de finalisation)